Investors often fail to distinguish between uncertainty and risk. This is partly because there is an army of strategists advising investors how to manage risk through market narratives. These narratives attempt to explain away the complexity of the world we live in, giving the impression that uncertainty can be managed. Although listening to stories is fun and can make us feel confident about the future, investors need to embrace uncertainty to generate robust returns rather than listening to those who attempt to explain it away.
A perfect example of this has been the liability driven investment (LDI) approach taken by many UK defined benefit pension funds. LDI was sold as a way of managing the uncertainty of meeting future liabilities. Large jumps in interest rates were considered unlikely and therefore conveniently ignored.
The balanced portfolio is another investment product that is based on thinking in terms of risk rather than uncertainty. Investors believe that by managing diverse portfolios they can better manage risk – but once again, it does not deal with uncertainty. Equity and bond returns this year were correlated, which resulted in balanced funds performing poorly.
No one likes to be told that we just don’t know enough about how the world works. But to generate robust returns through time, investors need to accept the reality of uncertainty. Investors, though, can manage this uncertainty by investing across the credit cycle. When uncertainty affects an investment portfolio in a rising credit cycle environment, losses to investors tend to be minimized. But when uncertainty affects a portfolio in a falling credit cycle environment, losses tend to be significant. In essence, the credit cycle acts as a way of hedging portfolios against uncertainty.
In Profiting from Monetary Policy I argued that it is possible to observe the credit cycle using Wicksell’s two rates of interest: the return on capital and the money rate of interest. As the difference between these two rates begins to rise, firms will experience greater profit growth and, therefore, rising capital values. As the difference between the two rates falls, it signals falling profit growth and declining capital values.
This simple model has been effective at minimizing the volatility of returns through time given that it does not attempt to explain what is happening, but instead indicates the short term outlook of the credit cycle on a quarterly basis. This quarterly period is long enough to prevent excessive trading costs eating up returns, but short enough to ensure that changes in the credit cycle are taken into account on a timely basis.
Year to date returns using this strategy are 10% versus -13% and -12% for US equities and US government bonds, respectively. The credit cycle signal indicated a shift into U.S. energy stocks in March of this year, followed a shift into US long maturity debt in June and then into US high yield debt in September.
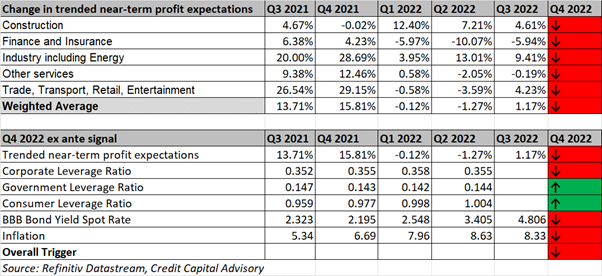
The profit expectations for the next quarterly credit cycle continue to be negative across all sectors of the economy. In addition, corporate leverage has fallen, indicating a negative outlook for future profits and therefore capital values.
Table 1: Outlook for US Wicksellian Differential
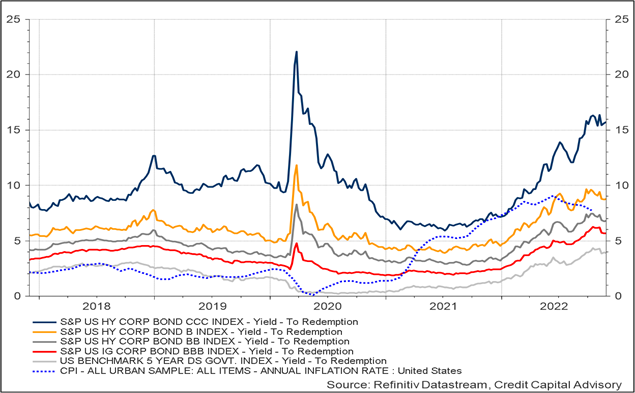
This indicates asset allocation should focus on US fixed income and not US equities. An assessment of US bond yields by credit category indicates that while US 5 year yields are around 4%, higher returns can be generated through both investment grade and certain credit categories of high yield. Although the CCC categories have experienced a significant widening of credit spreads above the government curve indicating an increased risk of default, this has not been the case for B credits and above. Hence the short term risk profile for B rated entities and above, remains reasonably positive.
Chart 1: US bond market indicators
Furthermore, a number of data points appear to back up the continuing resilience of credit spreads in the B rating and above categories. First, the jump in default rates as a result of COVID 19 means that many firms that would be most affected by the rise in interest rates have already defaulted, leaving a higher quality pool. Second, the US consumer continues to leverage up despite higher interest rate levels – and crucially this leverage is not particularly high when assessed through time. This is further supported by labour market data indicating decent nominal wage growth and continued low unemployment. Third, the Q3 credit transition data from Credit Benchmark on North American corporates continues to show a much higher number of obligors being upgraded into b and bb credit categories compared to the pre-pandemic period.
Table 2: Credit Transition Matrix – North America Corporates

Fourth, although the US yield curve is inverted while the Italian yield curve depicts a steep curve of lower maturities followed by a flattening at the long end, this does not necessarily indicate a pending US recession.
Chart 2: Yield Curve Comparisons
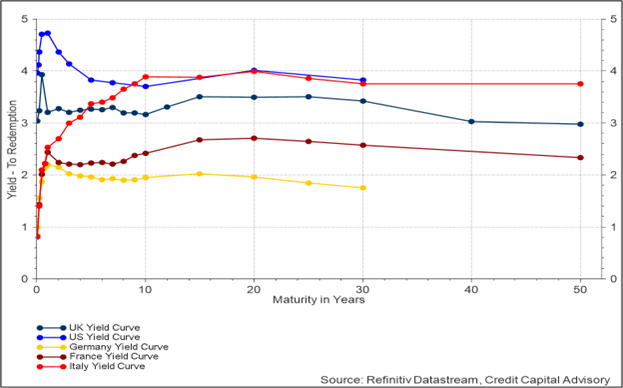
Indeed, if we adjust the nominal 5 year yields based on their respective credit quality using the 1 year through-the-cycle probability of default, the computed risk-adjusted yield is indicating continued robust demand in the US; particularly given that inflation is moderating faster in the US than it is in Europe. Italy’s return relative to its risk looks poor in comparison indicating significantly lower demand. This expected strength in demand in the US indicates that a jump in the default rates for B and BB high yield is unlikely in the short term.
Chart 3: Risk-Adjusted Yield Comparisons
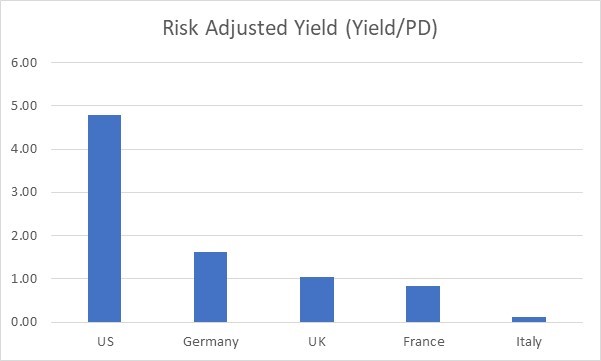
Source: Refinitiv Datastream, Credit Benchmark, Credit Capital Advisory
The medium term outlook is, however, uncertain and therefore unknowable. While stories about a deep recession or a soft landing might help us to confirm our existing biases, they don’t help investors manage uncertainty.
