This post, which is the first in a series of three on Piketty’s Capital in the 21st Century, argues that his assertion we are heading back to pre-WW1 levels of inequality remains speculative and not supported by his data. As Larry Summers critiqued in his review, “Rather than attributing the rising share of profits to the inexorable process of wealth accumulation, most economists would attribute both it and rising inequality to the working out of various forces associated with globalization and technological change.” However, Piketty’s dataset provides an invaluable resource that supports the argument that monetary policy needs to shift away from stabilising the general price level towards targeting nominal income growth to equal the rate of productivity growth, if the recent rise in inequality is to be addressed.
Fundamental laws of capitalism?
Piketty argues that he has uncovered two fundamental laws of capitalism. This post will focus on the results of his first law defined as α = r x β where α is the share of national income to capital, r is the return on capital and β is the capital/income ratio. Rather than critiquing the nature of the formula, particularly on the generic use of r for all forms of capital as Tyler Cowen has done, this post will focus on the interpretation of the results and the implications for public policy.
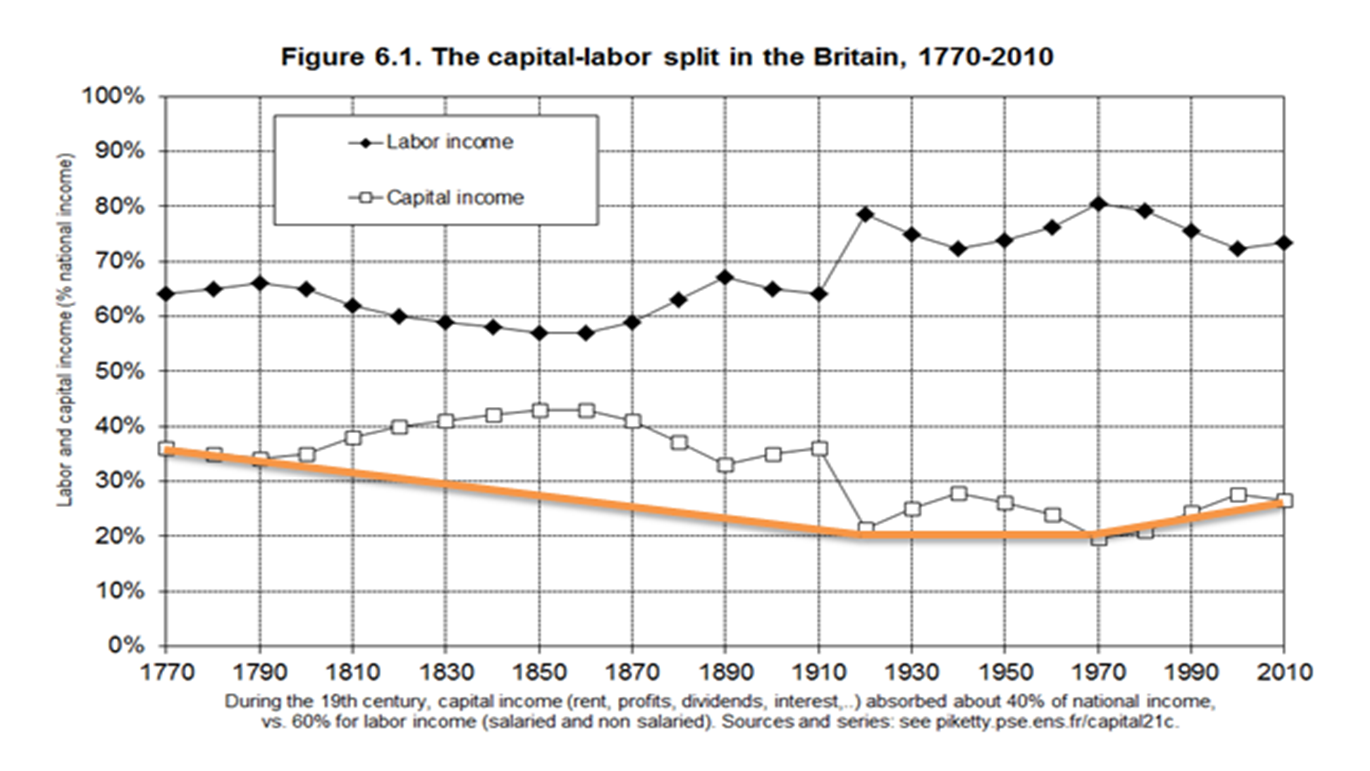
Using his assembled data for Britain, Piketty argues that α demonstrates a U-shaped curve similar to β, the capital/income ratio. The implication of this U-shaped curve, which I have added in orange , is that inequality is rising again which is the central point of his thesis and hence his recommendation for a global wealth tax.
Chart 1: Capital-Labour split in Britain

On closer inspection, however, the assertion of a U-shaped curve is highly questionable for two reasons. Firstly, with any long time series agreeing to a meaningful starting point is crucial as it can have a significant impact on the interpretation. Piketty chose 1770 because that’s where the dataset starts but given that Piketty is attempting to uncover the internal dynamics of capitalism, 1770 is not a sensible starting point.
Marx, in Capital Volume I, was quite specific about these issues arguing the most appropriate place for a starting point to analyse capitalism was 1846. In chapter 25 (General Law of Capitalist Accumulation) Marx argued that England between 1846 – 1866 was the best country to study the nature of capital due to the repeal of the Corn Laws in 1846 cutting off “the last retreat of vulgar economics”. According to Marx, free trade and international competition was a necessary condition for capitalist development.
In chapter 15 of Capital (Machinery & Large Scale Industry) which provided an analysis of Britain’s cotton industry, Marx argued that Britain was a monopolist of machines until 1815 with competition not actually setting in until the 1815 – 1830 period. Given this backdrop, the start of the time series from before 1830 would most likely generate misleading signals if one is attempting to analyse the nature of capitalism itself.
The second point is whether one can infer a U-shaped trend given the 1970 low point (the 1920 point is an outlier due to WW1) is located 75% of the way through the time series. As such the post 1970 data set is just too short to make any claim with regards to any fundamental insight into the nature of capitalism. Larry Summers doubted whether there was an iron law of capitalism in the first place that leads to rising wealth and greater inequality.
In order to substantiate the existence of a U-shaped trend, we would need data to at least 2040. Piketty does attempt to forecast where inequality might be headed in chapter 12 but given central banks can’t forecast GDP or inflation a year in advance as recently highlighted by Tim Harford, such attempts should not be taken too seriously. And to be fair to Piketty he does highlight this problem upfront in his book.
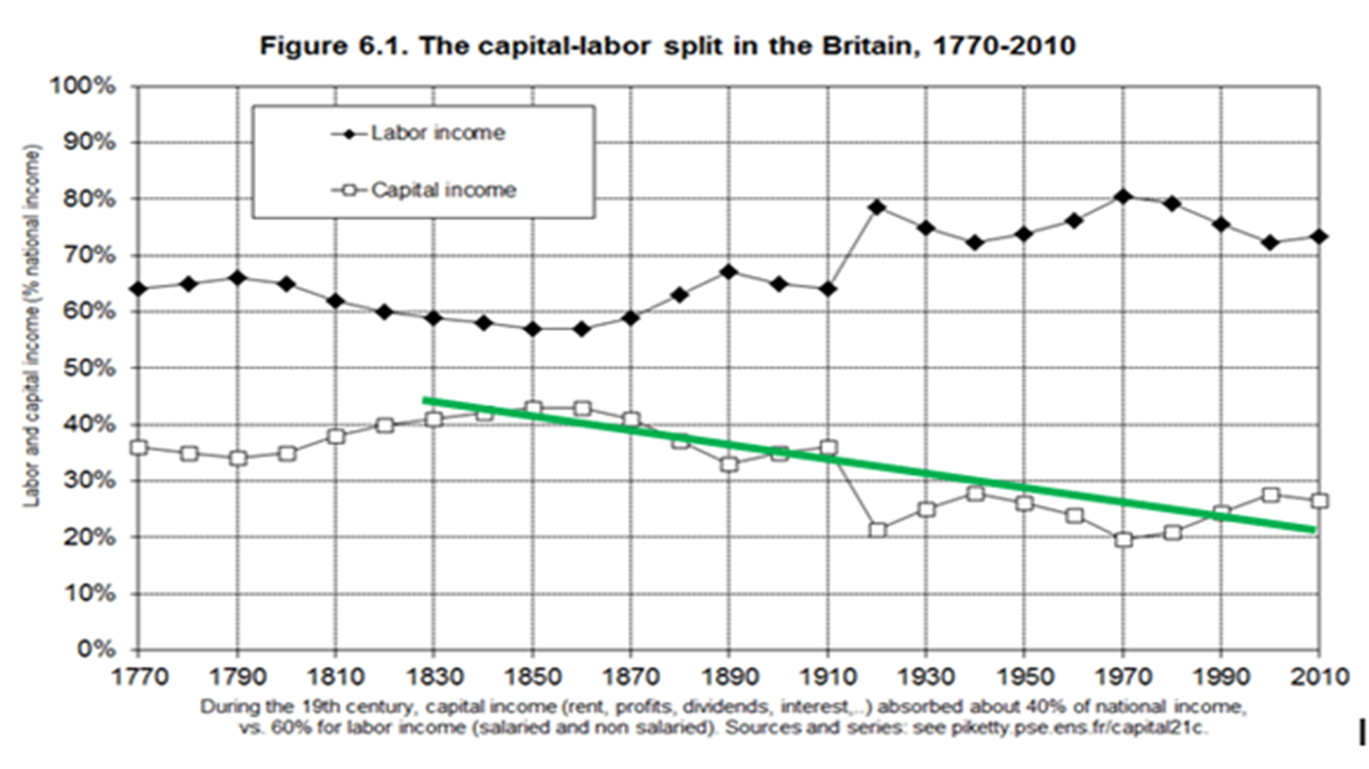
Given these issues, such a U-shaped interpretation appears to be highly dubious. Indeed, according to Piketty’s data we see α fall from 41% in 1830 to 27% in 2010 which is a 34% fall in the ratio of capital to income. When a simple linear trend line (in green) is plotted on this data set a broad secular decline in the share going to capital than a U-shaped trend appears to be a more appropriate interpretation.
Chart 2: Capital-Labour split in Britain

Piketty’s data set does though provide some insight into the current concerns raised by the OECD and others about the recent trend since 1970 that has seen a higher share of national income going to capital. Indeed, the U-shape between 1940 and 2010 is very clear, but it covers too short a time period to explain any fundamental shift in the dynamic of capitalism itself. The main concern here is that rising returns to capital at the expense of labour might lead to falling incomes, lower aggregate demand and higher unemployment. Some data, at least for the US economy suggests that this might already be of concern.
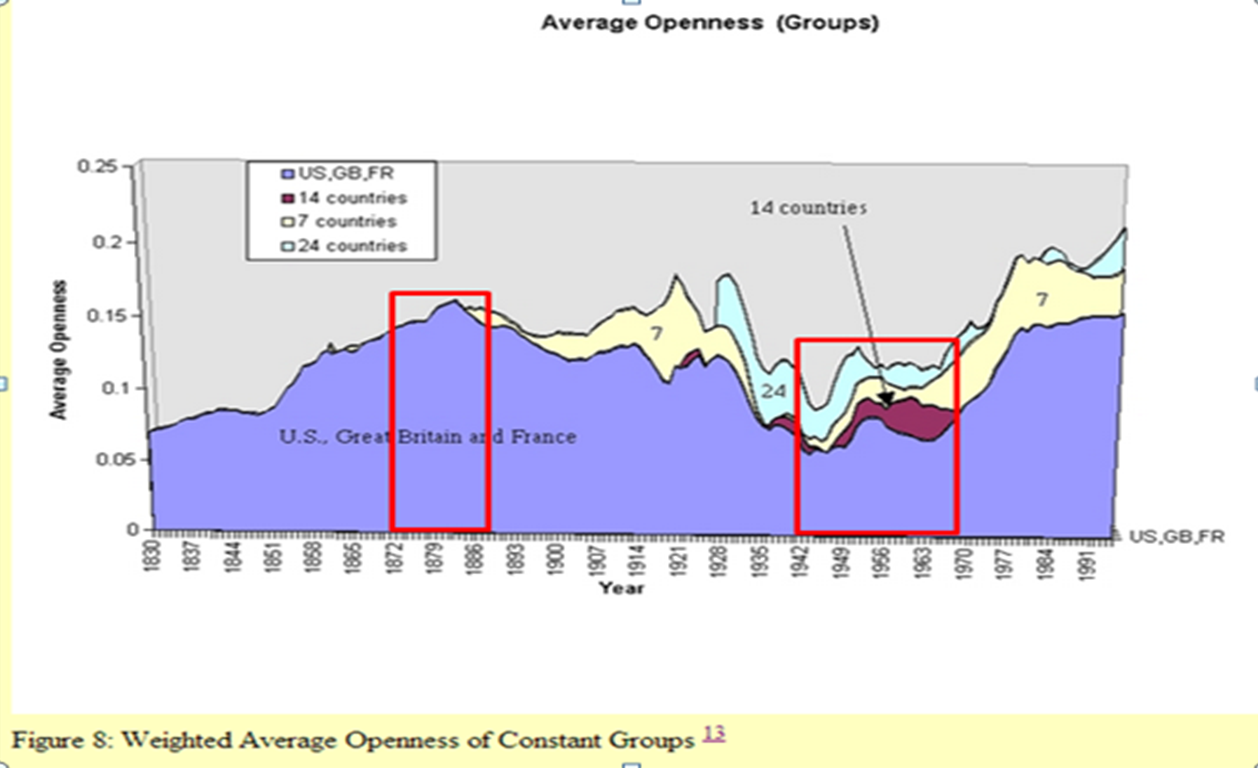
Returning to Piketty’s data set there are two periods in which the returns to labour grow at the expense of capital if one ignores the effect of WW1. The period that is mostly focussed on by commentators is the “30 Glorious years” between 1945 and 1975; the other period being between 1870 and 1890. However in many respects the earlier period, at least related to the extent of globalization and openness, more closely resembles our economy today. Analysis by a team of researchers at John Hopkins University shows that the level of openness reached between 1870-1890 was not surpassed until after the 30 Glorious Years had ended. (Red boxes added)
Chart 3: Trend in globalization / openness

Hence, understanding what was happening during the period 1870-1890 may turn out to be a better guide for policy given the above concerns raised by the OECD.
According to Piketty, the capital share of income fell 20% between 1870-1890 with the share of national income going to labour rising by 14% to 67%. So what explains this shift? George Cooper in post on Piketty argued that it was Trade Unions that led to greater equality. If that was the case we would have expected to have seen robust nominal wage growth throughout this period. But when the data is analysed, as provided by the Bank of England, it shows relatively weak nominal wage growth of 0.8% between 1870 and 1890 and a higher level of nominal wage growth between 1890 and 1920 at 1.1%. But Piketty’s data shows that between 1890 and 1910 income to capital increases at the expense of labour despite the higher levels of nominal wage growth.
As workers are displaced through increased global competition, they tend to gain new employment at lower wages levels. As such it is feasible that during the 30 glorious years, the relatively lower degree of openness and globalisation meant that labour was being displaced less and therefore had more bargaining power. Hence, the only way for labour to see a rise in real wages in an increasingly globalised environment is for prices to fall. Thus one of the solutions to rising inequality highlighted by Piketty’s data is that monetary policy needs to be reappraised.
In a recent speech, Mark Carney the governor of the Bank of England raised the very issue of inequality, although did not appear to make the link that monetary policy might be a determining factor here. Some data comparisons between 1870-1890 and 1890-1910 will help illuminate the issue.
Between 1870 and 1890, the average annualised rate of inflation was -0.3 compared to 0.4% between 1890 and 1910. As a result of falling prices, real wages grew at a much faster rate between 1870-1890 than between 1890-1910 at 1.1% vs 0.7% respectively pa. This faster rate of real wage growth was also accompanied by higher real interest rates. Between 1870-1890 real interest rates averaged 3.3% vs 2.2% between 1890-1910. The level of real interest rates is of course something that central banks can have an impact on. However, the current approach to monetary policy which targets the general price level means that productivity gains are not being passed on to workers given the general downward pressure on nominal wages.
Should the Bank of England wish to address the issue of inequality, then a new monetary regime that targets nominal income to grow at a rate equal to productivity would need to be implemented as suggested by George Selgin and David Beckworth.
This is why Piketty’s data set is so important – and why Larry Summers’ review of his book was spot on.

See this post – it has different/ additional take on the late 19thC.
http://georgecooper.org/2014/05/24/the-horrible-history-of-mr-piketty/
Thanks George. I missed this one. Very interesting. The falling value of capital (particularly of agricultural land) tends to substantiate Piketty’s estimates that between 1870-1890 incomes to labour rose. I’ve not been able to find any equity return data for this period, but given that there was a Royal Commission on Britain to ascertain why profits were falling one has to assume that equity returns were poor. My assumption is that had central banks been running the show between 1870-1890 they would have floored interest rates because of the dynamics you mentioned in order to support capital.