The IMF has recently produced an interesting paper on the trend in global interest rates over the last 30 years. The paper argues that real interest rates have fallen over the last 30 years in three phases. In the 1980s and early 90s it was due to monetary policy, the mid to late 90s it was due to fiscal policy improvement and since 2000 due to three main factors:
1. A steady growth in real incomes in Emerging Markets has led to higher savings rates – The IMF forecasts this will slowdown in the future.
2. Increase in demand for safe assets – The IMF believes this is unlikely to be reversed.
3. Persistent decline in investment rates since the Crisis – The IMF argues that investment to GDP ratios are unlikely to recover in the short term to pre-crisis levels.
As a result the IMF argues that the outlook for upward movement in real interest rates is muted. Whilst their prognosis is highly plausible, they do not assign any role for falling inflation risk. This outlook seems to contradict their view that monetary policy played a big role in at least in the first phase of the decline in real interest rates. The IMF argues that:
“Because inflation risk affects the term premium, a common decline in long term real rates may be due to simultaneous adoption of monetary policy frameworks that ensure low and stable inflation. However, such simultaneous adoption would not explain the trend decline in short-term real rates, because such rates are little affected by inflation risk. In other words, a worldwide decline in the inflation risk premium would have caused a similar decline in the term spread, which has not happened.”
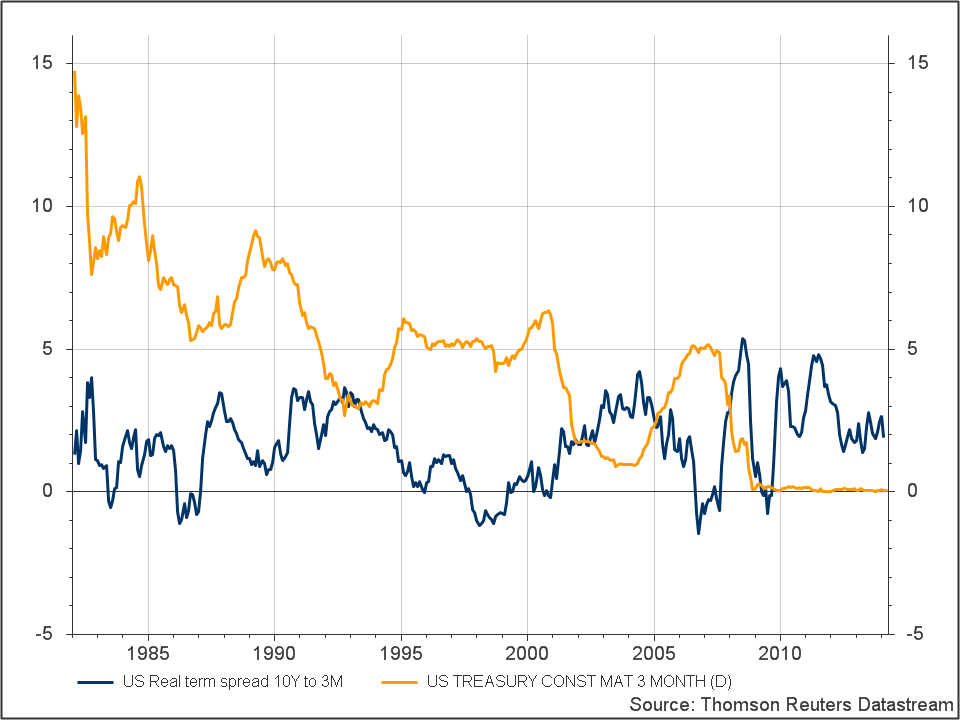
The IMF seems to be arguing that a fall in long term inflation risk cannot explain short term rate falls because short term rates are not affected by inflation risk which is why there hasn’t been a downward trend in the term spread between short and long term rates. To the extent that real term spreads have not demonstrated a similar downward trend to real long term rates this is correct. Chart 1 shows the real term spread over the period in blue. We see a decline between 1982 and 1986, a further decline from 1992 to 1999 and again from 2004 to 2007. However each of these declines was followed by an upward trend, including during the 1980s and early 90s when the IMF argued that monetary policy was the main driver of falling real interest rates. Paul Volcker’s approach to increasing short term nominal rates was implemented to reduce inflation expectations which eventually permitted real interest rates to fall, but the real term spread rose from 1986 which seems to contradict the IMF’s statement on the role of monetary policy during this period.
If we now look at the behaviour of the yellow line which is the short term nominal rate, and strongly influenced by the Fed Funds Target rate, we start to see a pattern that helps explain the movement of the term spread. Firstly we see that the nominal rate of interest has fallen from a high of almost 15% to effectively zero over the period with some short term upward movements. The general downward trend has been possible because of lower inflation expectations which has caused the term spread to adjust over the period. Secondly, the volatility of the components of the real rate including rising long term inflation expectations and the Fed’s influence on short term nominal rates impact the term spread by raising long term real rates and reducing short term real rates respectively. Indeed, the Fed’s policies towards adjusting short term nominal rates can have a significant impact on the term spread as the long end of the yield curve is also driven by factors outside the Fed’s control. As such one would not expect to be able to observe a general falling real term spread given the dramatic movement in nominal rates and the imprecise nature of monetary policy.
Chart 1: 10Y to 3m term spread vs 10Y inflation expectations to actual inflation

Another way of understanding the mechanics of falling real interest rates and thereby the behaviour of the term spread is to use the Fisher Equation often described as:
i = r + dp/dt
Where i is the nominal rate of interest, r real rate and dp/dt the rate of inflation (actual or expected depending on short or long term rates).
The three data points that are of interest in table 1 are 1990, 2002 and 2010. In these three cases we see a rise in the term spread. In 1990 the term spread jumps due to rising long term inflation expectations in conjunction with falling short real term rates due to higher actual inflation. In 2002 the rise in the term spread is caused by a fall in the short term nominal rate which is repeated again in 2010 in an attempt by the Fed to stimulate the economy.
Table 1: Components of the Fisher Equation

Source: Datastream, Cleveland Fed
In essence, the Fed’s intervention to stabilise the economy can cause the real term spread to rise due to rising inflation expectations as a result of loose monetary policy and falling short term nominal rates in an attempt to stimulate the economy. However to argue that inflation risk has not fallen over the period appears to be disingenuous. The data demonstrates the general tendency of higher inflation expectations to occur when actual inflation is higher. As inflation expectations and actual inflation will tend to fall together, short and long term nominal rates will also fall together. Thus it is hard to come to the conclusion that falling inflation expectations has not had some impact on falling real interest rates.
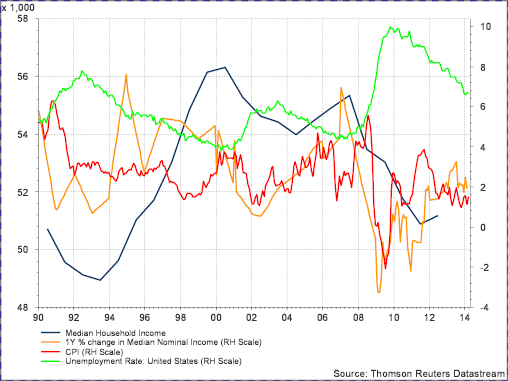
If falling inflation expectations have been a factor in driving down long term real interest rates then understanding what has been behind this will be crucial to forecasting the future trajectory of real rates. If we now look at the blue line in chart 2, we can see that median real wages have been in decline since 2000. The fact that the orange line (nominal wage growth) has mostly underperformed the red line (inflation) is the reason behind this. Besides the spike in 2007 when unemployment dipped under 4.5%, there has been limited upward pressure on nominal wages since 2000, which is also one of the reasons why inflation expectations remain subdued. There is a great deal of evidence that the reason behind this sluggish upward pressure on nominal wages is because of globalisation and to a lesser extent the substitution of capital for labour. If that is indeed the case we can expect to see continued muted upward pressure on US nominal wages despite low real interest rates for some time to come, particularly given the current unemployment rate of 6.7%.
Chart 2: Real and nominal wages, CPI and unemployment

As a result, it would appear that the IMF is wrong to ignore the possibility of falling inflation expectations having an impact on low real interest rates, but still right to argue that the future of real interest rises is muted.
