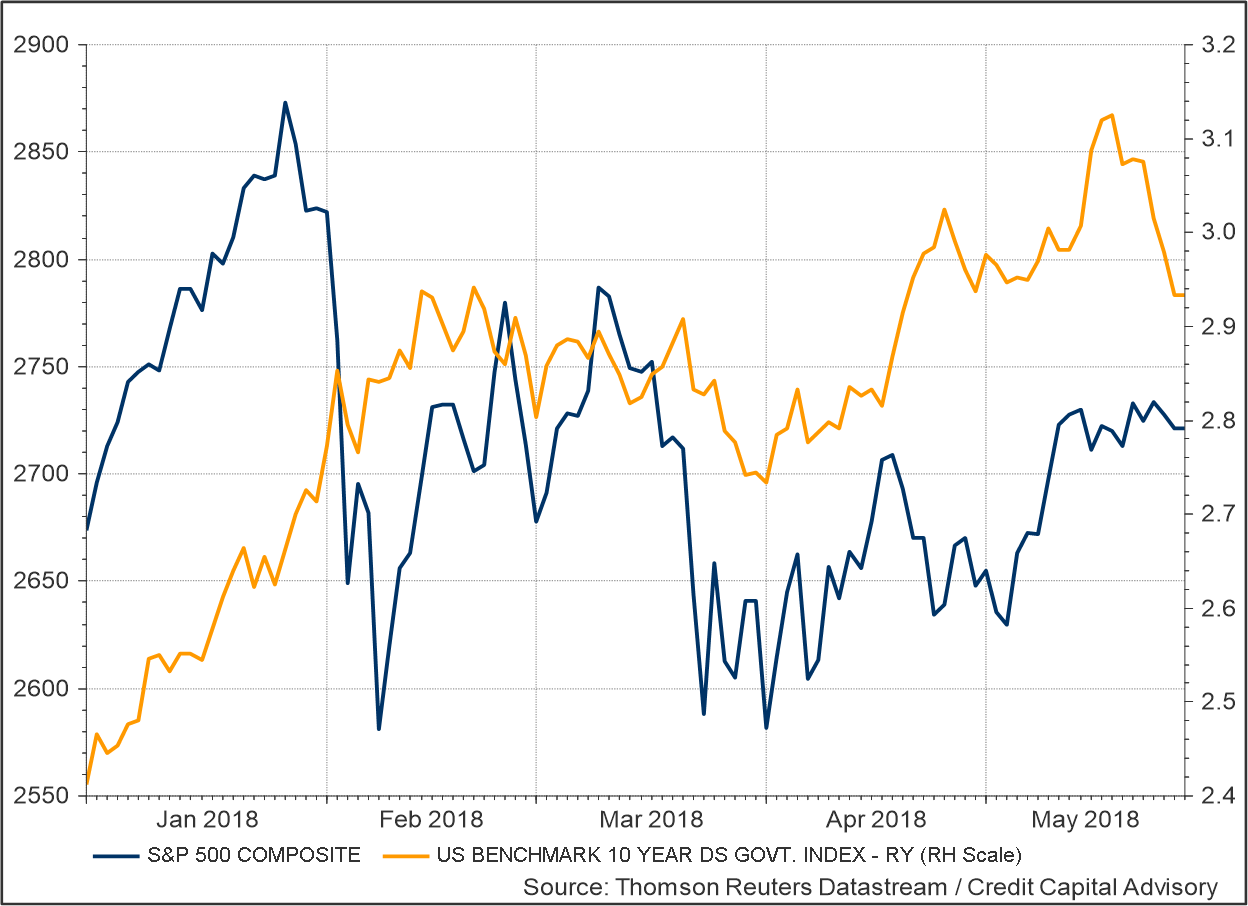
The first quarter of 2018 was tough for asset allocators. Between January 26 and April 2, the S&P 500 dropped 10%, while 10 year government bond yields continued to widen. This shift in market sentiment combined with an intense newsflow of a pending global trade war and the impact of the United States withdrawing from the Iran nuclear deal, put asset allocation models with a positive US equities outlook under increasing scrutiny.
Chart 1: US equity and bond market
The Credit Capital Advisory signal has been continuously positive for US profit growth since August 2016. Clearly, the market will move into a negative phase at some stage, however pursuing an investment strategy that follows a consistently bearish outlook doesn’t help much in generating excess returns. The point of dynamic asset allocation is to generate superior returns to buy and hold with lower volatility.
The reality is that it is almost impossible to know whether a full-blown international trade war will develop, and the geo-political effects of the US withdrawing from the Iran deal are hard to ascertain. Even the medium term price of oil is subject to numerous dynamic factors that make forecasting oil prices challenging at the best of times.
So how should asset allocators deal with a sudden inflow of new information that appears to contradict an underlying signal? In Reminiscences of a Stock Operator, Lefevre, writing about the investor Jesse Livermore, was at pains to emphasise every time he overrode his system based on a hunch, he lost his money. As Hayek explained in his 1945 seminal paper, The Use of Knowledge in Society, understanding the economy “is a problem of the utilization of knowledge not given to anyone in its totality.”
Although the price mechanism provides insight into the current state of the economy, the complexity of the economy means that market prices are unable to forecast too far into the future. As argued in Profiting from Monetary Policy, a neo-Wicksellian approach to asset allocation attempts to mitigate these issues by assessing the phase of the credit cycle based on the short-term expectations of profit growth, and the changing nature of leverage across the economy.
The May 2018 report still indicates a positive signal for US profit growth. Indeed, since the start of Q2, equities have recovered some of their losses. However, the signal also indicates that the credit cycle is moving into a new phase.
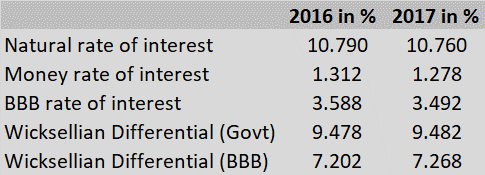
The ex post indicator for 2017 – as predicted by the ex ante signal – demonstrated positive growth. However, the natural rate of interest or return on invested capital did fall slightly, with the Wicksellian Differential rising only due to the falling cost of funding.
Table 1: Ex post Wicksellian Differential – United States
Source: Thomson Reuters Datastream, Credit Capital Advisory
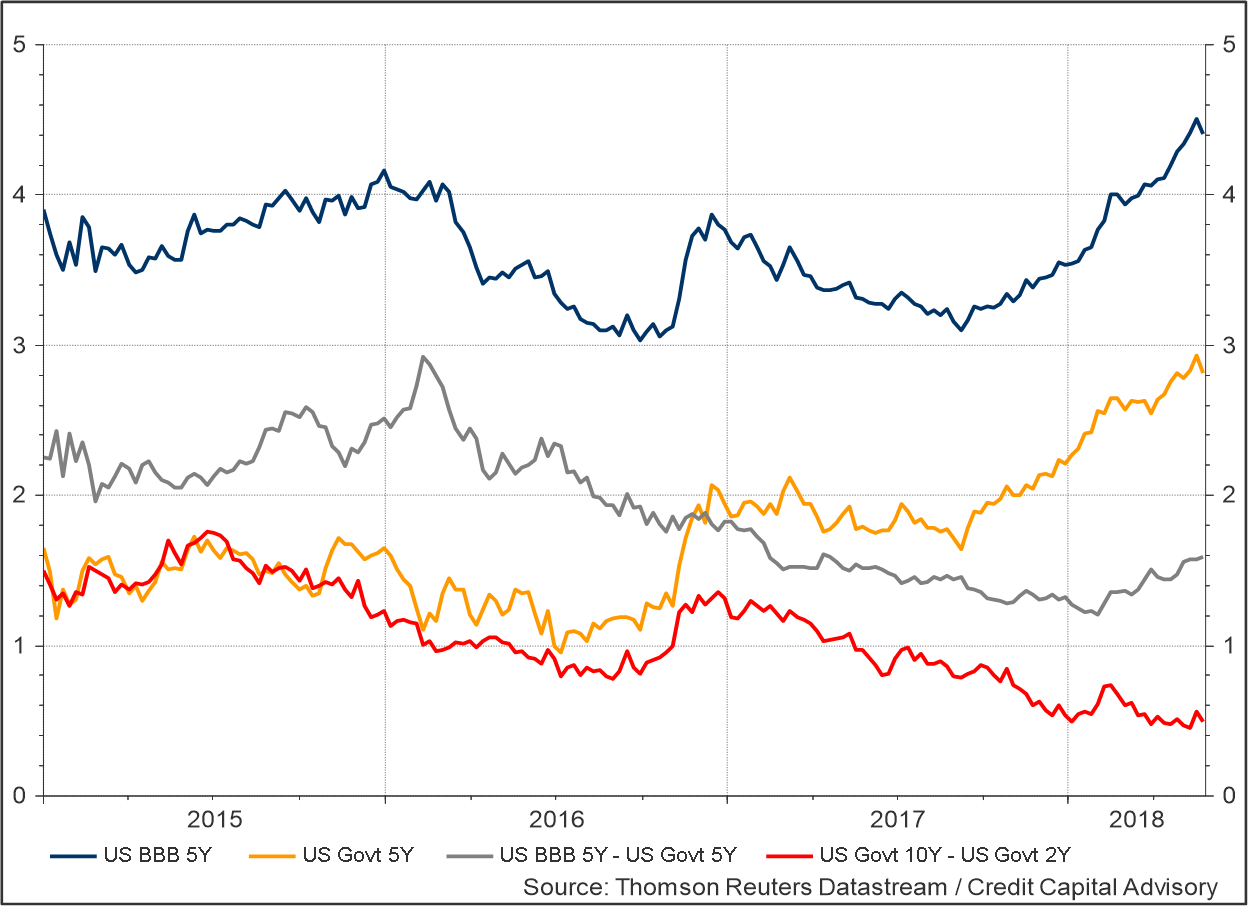
What happens in the bond market will therefore play a critical role on future profit growth. Although yields have widened since the beginning of the year, the spread between the BBB rate and the government 5Y rate (grey line) has fallen from 2.2% to 1.6%. Furthermore, the term spread between the 10 year and 2 year point (red line) has also maintained its downward trajectory, indicating a flattening curve, which is often associated with the final phase of a credit cycle.
Chart 2: US bond market indicators
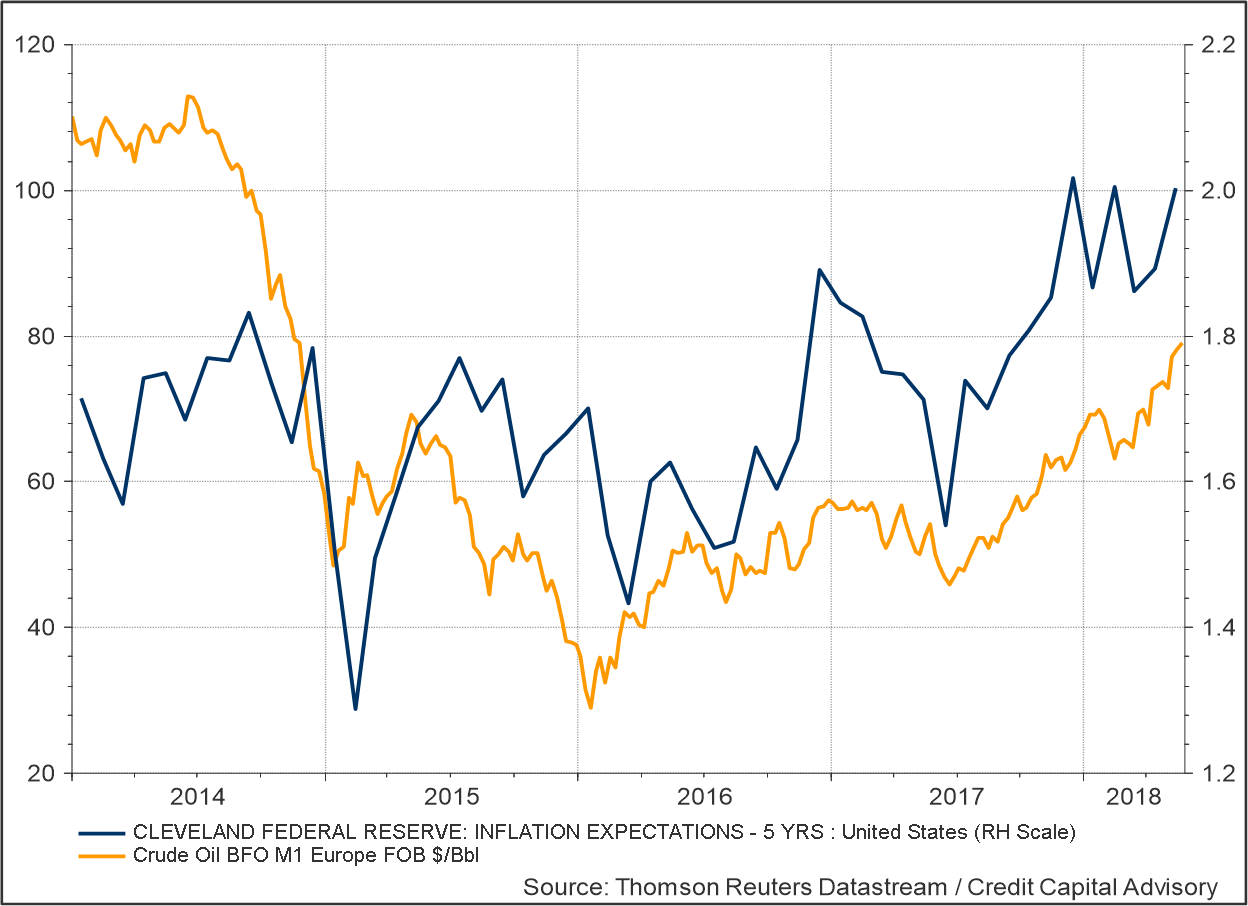
One important driver of bond yields is inflation expectations, which according to the Cleveland Federal Reserve continue to rise. Indeed, five year expectations are now above 2%, which appear to be influenced by rising oil prices.
Chart 3: 5 year inflation expectations vs oil prices
The Fed at its last meeting in early May unanimously voted to maintain short term interest rates at current levels. The minutes from the FOMC meeting stated “the current stance of monetary policy remained accommodative, supporting strong labor market conditions and a return to 2 percent inflation on a sustained basis.”
This suggests that even if commodity prices do increase, the Fed might not raise interest rates as it did in 2008 – which exacerbated the economic downturn. Hence the cost of funding, assuming a trade war is averted and there is no medium-term commodity bull market, can be expected to remain reasonably close to current levels. The news flow hysteria of bond market Armageddon if 10 year yields hit their historical average between 1870 and 1960 has proven as expected to have been just noise. But what is the outlook for future profits?
With regards to the ex ante indicators, only two of the five macro sectors are still in a positive phase including services and trade & transportation. The outlook for financial services, construction and industry indicate falling rates of profit.
Table 2: Q2 2018 Ex ante signal: United States

Source: Thomson Reuters Datastream, Credit Capital Advisory
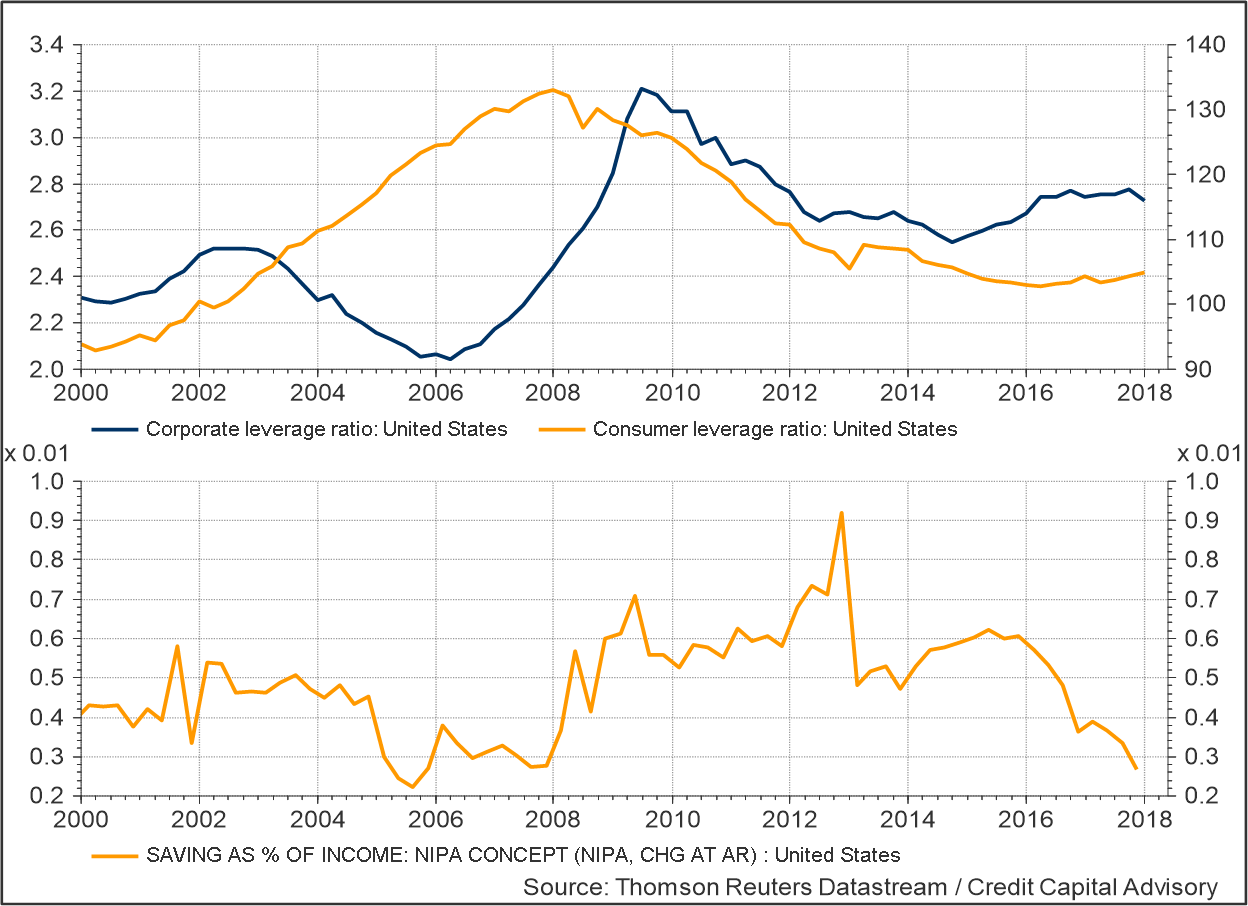
Of greater interest for asset allocation is what is happening to leverage ratios across the economy. Critically, consumers appear to have learned lessons from the financial crisis and have not pursued an aggressive borrow now, pay or default later, strategy. However, the savings rate continues to fall which may explain why the corporate sector is not leveraging up to invest as it does not see much increase in future demand.
It is possible that a significant productivity increase could raise real income levels, thereby re-energizing the bull market. The most recent data is slightly more positive, however, this would need to be sustained quarter after quarter to generate higher profits.
Chart 4: Corporate, Consumer leverage ratios and the savings rate
Accepting that the future trajectory of the credit cycle is an unknown is central to profitable asset allocation. Although the outlook for profits remains positive, the cycle has clearly moved into a new phase. This phase may still provide opportunities for investors, but unless productivity shifts into a higher gear, the risks of a reversal in the cycle are clearly rising.
